- Stats: 810 1
- Posted: May 14, 2019
- Category: Real Estate
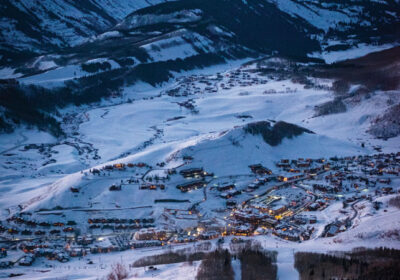
The Crested Butte Real Estate Report
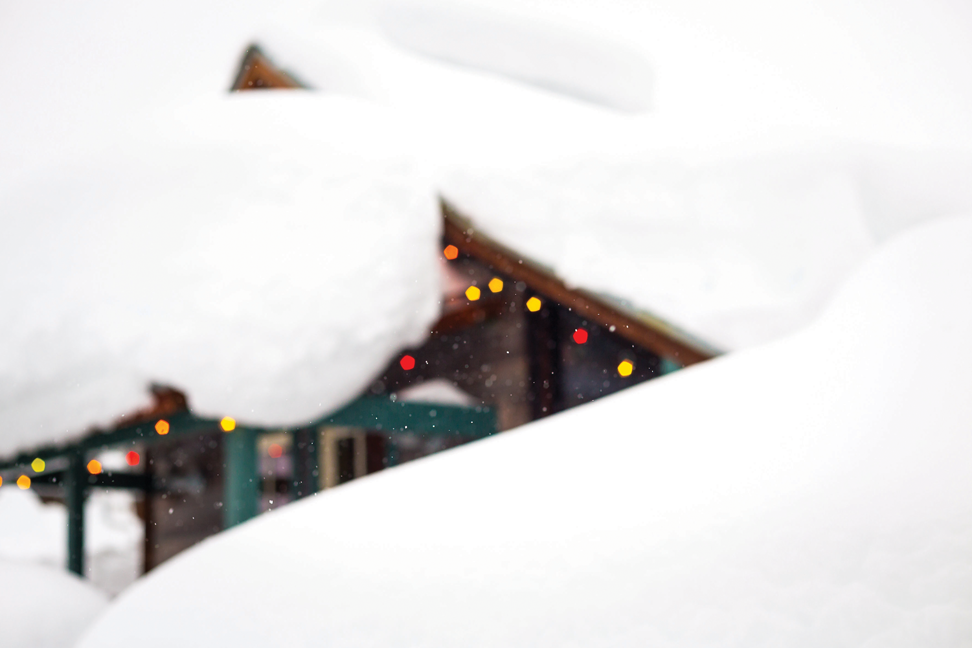
As we approach what many locals consider to be the most exciting time of year– winter – it’s time to reflect on how the real estate market is doing. It’s a question many realtors are frequently asked. Most realtors would love to say that real estate is doing “awesome” and many may be tempted to report just that. Some may declare that it is a “Buyers” market or a “Sellers” market. However, we look at the statistics to tell us what is happening in Crested Butte area real estate. This is an update to our twice-yearly report on the different sectors of the Crested Butte real estate market.
By Doug Duryea
Single Family Homes
Mt. Crested Butte
Single-family home sales in Mt. Crested Butte. Average “sold” prices are as follows:
Year – Number of Homes Sold – Average Sale Price
2008 – 13 – $1,515,096
2009 – 13 – $1,212,108
2010 – 12 – $641,908
2011 – 22 – $882,068
2012 – 19 – $875,166
2013 – 22 – $1,034,055
2014 – 25 – $683,890
2015 – 26 – $968,403
2016 – 22 – $1,149,301
2017 – 30 – $1,015,340
2018 – 28 (first 10 months) – $1,056,205
Currently, the average asking price for the 19 active single-family homes in Mt. Crested Butte is $1,830,842 Prices range from $750,000 to $3,500,000.
Town of Crested Butte
In the town of Crested Butte the average sold price of a single-family home has varied widely:
Year – Number of Homes Sold – Average Sale Price
2008 – 12 – $1,037,750
2009 – 19 – $820,368
2010 – 20 – $745,075
2011 – 17 – $1,197,367
2012 – 25 – $633,140
2013 – 26 – $912,836
2014 – 29 – $1,028,630
2015 – 26 – $803,403
2016 – 25 – $1,283,060
2017 – 23 – $1,363,623
2018 – 19 (first 10 months) – $1,155,962
Currently, in the town of Crested Butte, there are 19 active single-family listings, ranging in price from $800,000 to $5,900,000. These homes have an average asking price of $2,042,052.
Skyland/Country Club area
The Skyland golf course area has seen the following activity:
Year – Number of Homes Sold – Average Sale Price
2008 – 0 – 0
2009 – 3 – $1,520,000
2010 – 7 – $905,357
2011 – 8 – $813,862
2012 – 4 – $651,250
2013 – 6 – $939,500
2014 – 2 – $1,412,500
2015 – 9 – $1,355,555
2016 – 6 – $1,733,166
2017 – 10 – $1,474,250
2018 – 5 (first 10 months) – $1,566,700
There are presently two single-family homes for sale in the Skyland/Country Club area with an average asking price of $3,237,500.
CB South
Average sold single-family home prices in CB South have experienced the following:
Year – Number of Homes Sold – Average Sale Price
2008 – 8 – $503,125
2009 – 9 – $450,500
2010 – 8 – $371,178
2011 – 20 – $337,580
2012 – 15 – $374,050
2013 – 20 – $396,870
2014 – 16 – $396,909
2015 – 18 – $484,972
2016 – 12 – $610,450
2017 – 18 – $632,444
2018 – 15 (first 10 months) – $675,042
There are currently five single-family homes for sale in CB South ranging from $479,000 to $1,500,000, now averaging $793,200.
Condominiums/Townhomes
Mt. Crested Butte
Here’s a look at what’s happening with Mt. CB condos:
Year – Number of Condos Sold – Average Sale Price
2008 – 35 – $482,097
2009 – 54 – $353,558
2010 – 62 – $332,174
2011 – 89 – $225,565
2012 – 77 – $254,062
2013 – 94 – $260,468
2014 – 131 – $253,451
2015 – 81 – $267,523
2016 – 147 – $264,869
2017 – 142 – $363,387
2018 – 114 (first 10 months) – $373,574
Currently there are 38 condo/townhome units for sale in the MLS system in Mt. Crested Butte, ranging in price from $159,000 to $2,100,000. The average asking price for a mountain condo is currently $607,060.
Town of Crested Butte
The condo/townhome market in the town of Crested Butte has witnessed the following growth statistics over the last few years:
Year – Number of Condos Sold – Average Sale Price
2008 – 7 – $521,714
2009 – 12 – $358,283
2010 – 10 – $301,440
2011 – 6 – $208,729
2012 – 9 – $303,500
2013 – 10 – $268,278
2014 – 11 – $426,250
2015 – 12 – $385,975
2016 – 11 – $421,454
2017 – 8 – $511,812
2018 – 14 (first 10 months) – $502,122
There are presently five condos/townhomes for sale in town ranging from $257,000 to $1,900,000.
Skyland/Country Club area
The condo/townhome market at the Skyland/Country Club area has witnessed the following sales figures:
Year – Number of Condos Sold – Average Sale Price
2008 – 7 – $800,625
2009 – 5 – $307,500
2010 – 6 – $441,150
2011 – 9 – $380,555
2012 – 15 – $384,821
2013 – 11 – $476,043
2014 – 6 – $681,833
2015 – 2 – $586,250
2016 – 9 – $431,555
2017 – 11 – $666,340
2018 – 10 (first 10 months) – $691,916
There are currently 10 condos/townhomes for sale in the Country Club area averaging $1,159,700.
CB South
There are a few condo/townhomes in CB South. Sales statistics here show the following in recent years:
Year – Number of Condos Sold – Average Sale Price
2008 – 9 – $334,720
2009 – 7 – $302,285
2010 – 6 – $210,558
2011 – 18 – $110,000
2012 – 11 – $164,945
2013 – 16 – $166,600
2014 – 9 – $255,222
2015 – 22 – $220,968
2016 – 13 – $330,346
2017 – 17 – $344,617
2018 – 18 (first 10 months) – $392,592
Presently, there are eight condos/townhomes for sale in CB South ranging in price from $285,000 to $596,500, with an average asking price of $516,800.
Vacant Lots (up to 5 acres)
Mt. Crested Butte
Vacant land sales in the Mt. Crested Butte area have seen the following activity:
Year – Number of Lots Sold – Average Sale Price
2008 – 3 – $691,667
2009 – 2 – $602,500
2010 – 4 – $173,250
2011 – 6 – $187,083
2012 – 21 – $224,176
2013 – 13 – $156,000
2014 – 13 – $271,590
2015 – 13 – $265,346
2016 – 11 – $219,263
2017 – 24 – $308,912
2018 – 22 (first 10 months) – $369,977
There are currently 39 active land listings for sale in Mt. Crested Butte, ranging in price from $119,00 to $750,000, with an average asking price of $377,664.
Town of Crested Butte
Residential lot sales in the town of Crested Butte have done the following:
Year – Number of Lots Sold – Average Sale Price
2008 – 5 – $678,750
2009 – 3 – $418,333
2010 – 5 – $399,350
2011 – 6 – $469,333
2012 – 7 – $371,571
2013 – 7 – $631,642
2014 – 5 – $466,435
2015 – 10 – $546,800
2016 – 10 – $635,100
2017 – 6 – $724,999
2018 – 1 (first 10 months) – $200,000
There are now 15 vacant town lots for sale with an average asking price of $941,593 (ranging from $200,000 to $1,350,000).
Skyland/Country Club area
The Skyland area has seen the following land sales activity over the years:
Year – Number of Lots Sold – Average Sale Price
2008 – 4 – $320,000
2009 – 5 – $258,833
2010 – 4 – $217,475
2011 – 4 – $54,025
2012 – 5 – $240,500
2013 – 3 – $116,665
2014 – 5 – $179,800
2015 – 8 – $218,500
2016 – 5 – $195,000
2017 – 22 – $233,318
2018 – 9 (first 10 months) – $289,666
As of November 2018, there were 29 active homesite listings in the Skyland/Country Club area with an average asking price of $396,651. Prices range from $89,000 to $1,200,000.
CB South
Residential vacant land prices in CB South shot up tremendously in 2005, but have been dropping most recently. Here are the statistics for this area:
Year – Number of Lots Sold – Average Sale Price
2008 – 7 – $143,143
2009 – 6 – $71,000
2010 – 2 – $77,000
2011 – 13 – $37,238
2012 – 13 – $43,807
2013 – 9 – $43,861
2014 – 13 – $62,153
2015 – 36 – $68,277
2016 – 25 – $75,410
2017 – 23 – $83,739
2018 – 35 (first 10 months) – $91,008
There are currently 21 residential lots for sale in CB South averaging $145,530 per lot. Prices range from $69,000 to $195,000.
Ranches/11+acre sites
Ranches and tracts of land between 11 to 45 acres in the Crested Butte area (CB area = Rural CB, CB South, Town of CB, Mt. CB & Rural Mt. CB). Statistics show the following in this market:
Year – Number of Parcels Sold – Average Sale Price
2008 – 7 – $1,019,286
2009 – 4 – $1,410,000
2010 – 3 – $758,000
2011 – 4 – $277,250
2012 – 4 – $287,500
2013 – 9 – $442,111
2014 – 4 – $260,000
2015 – 5 – $413,000
2016 – 10 – $262,500
2017 – 4 – $606,875
2018 – 13 (first 10 months) – $434,000
Currently there are 38 listings of ranches/11+acre parcels in the CB area, ranging in size from 11 to 45 acres. These parcels have an average asking price of $984,578 per homesite. Most of the larger parcels can be found at the Danni Ranch, Whetstone Mountain Ranch, Red Mountain Ranch, Trappers Crossing, Roaring Judy Ranch, and The Smith Hill Ranch.
Overall picture
Overall, real estate sales in all categories (residential, vacant land, ranchland and commercial) have resulted in the following numbers in the Crested Butte area:
Year – Number of Listings Sold – Total Sales Dollars
2008 – 155 – $109,126,355
2009 – 160 – $84,438,857
2010 – 172 – $80,472,462
2011 – 275 – $107,199,003
2012 – 265 – $102,499,018
2013 – 329 – $144,299,223
2014 – 328 – $146,822,075
2015 – 356 – $162,997,659
2016 – 365 – $181,053,197
2017 – 435 – $249,649,770
2018 – 379 (first 10 months) – $195,566,858
As of November 2018, there were 65 properties under contract totaling $39,033,249 in potential closed sales.
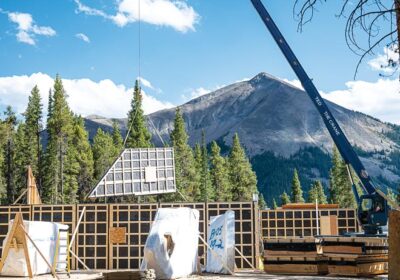
We are bullish on the continuation of a robust real estate market this winter. Our inventory levels continue to drop throughout the area and demand continues to be strong, even in the off-season months. Builders and developers are very busy with new homes and projects, and mortgage rates remain very attractive. All these are very encouraging signs of continued strength in Crested Butte real estate.
The above figures and data were taken from Gunnison Country Association of Realtors’ MLS system.
Doug Duryea is the Managing Broker/Realtor for Crested Butte Resort Real Estate in Mt. Crested Butte, CO. He can be contacted at 970-275-2355, duryea.doug@gmail.com or www.cbliving.com.
Related Posts